Improving map performance with Canvas
Background
From 2020 to 2023, I developed dashboards and mapping tools for a warehouse automation system using TypeScript, React and SVG.
Problem
Our custom mapping system was built with SVG. While SVG was versatile and worked nicely with React, it showed strain when we tried to render more than a few hundred elements at once. We needed a performant way to create complex data visualizations like heat maps.
Solution
I added a drawing surface to the map using the Canvas API, along with utility methods for working with the map's coordinate system. This allowed us to draw thousands of individual elements on the screen without sacrificing performance, as shown in the following examples:
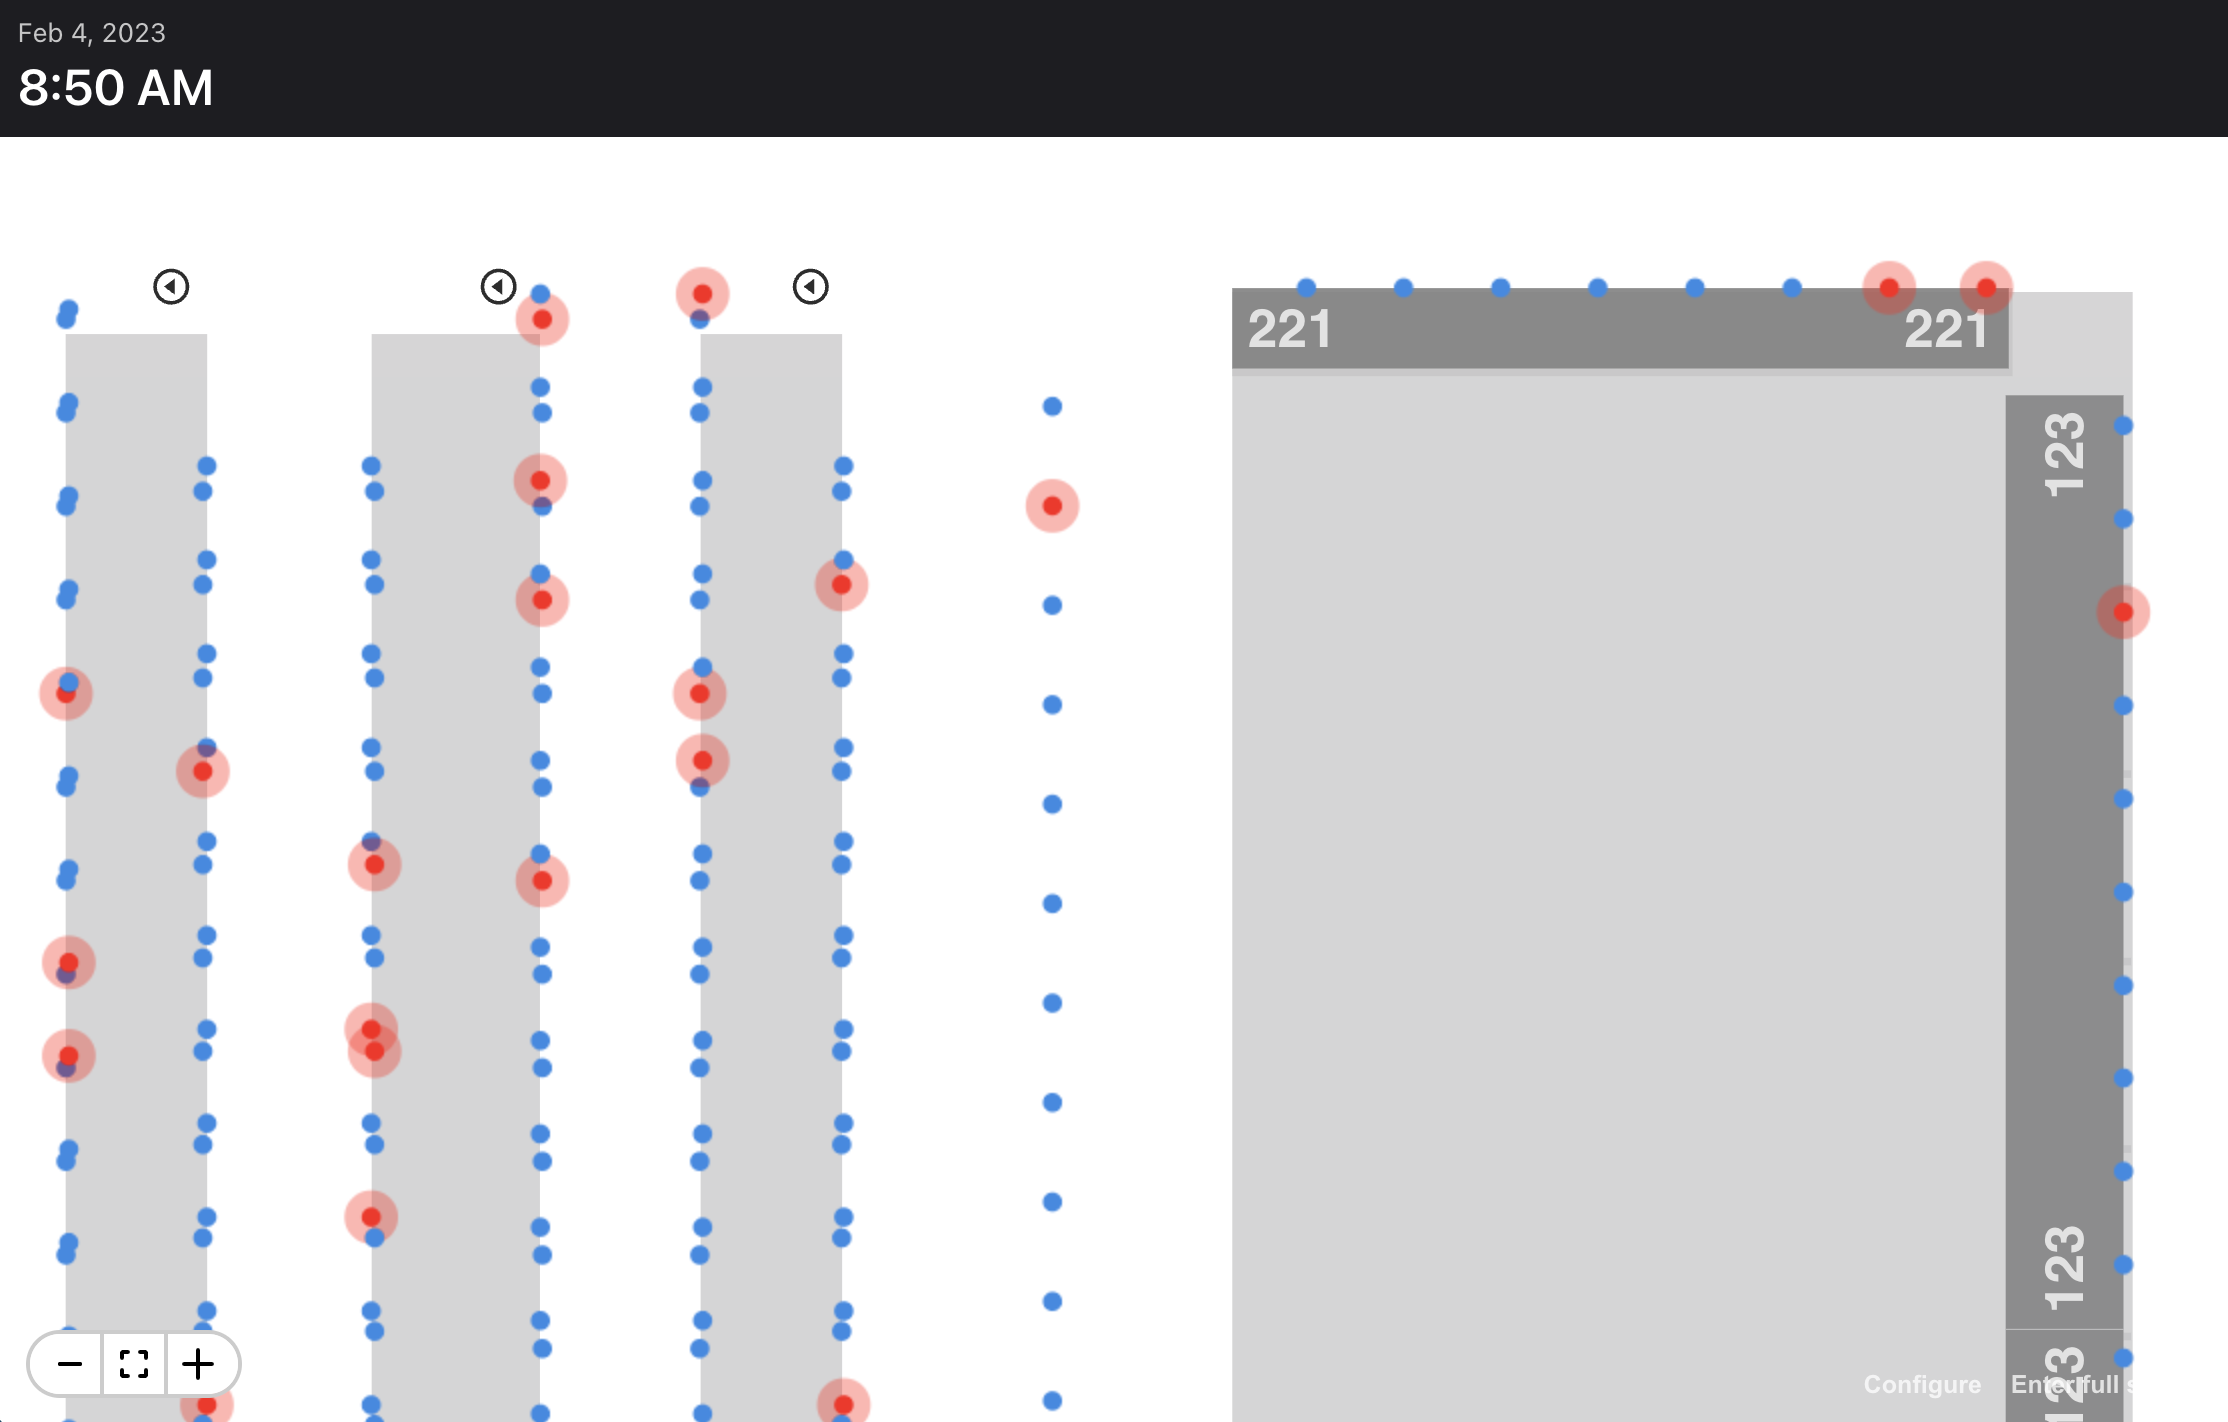
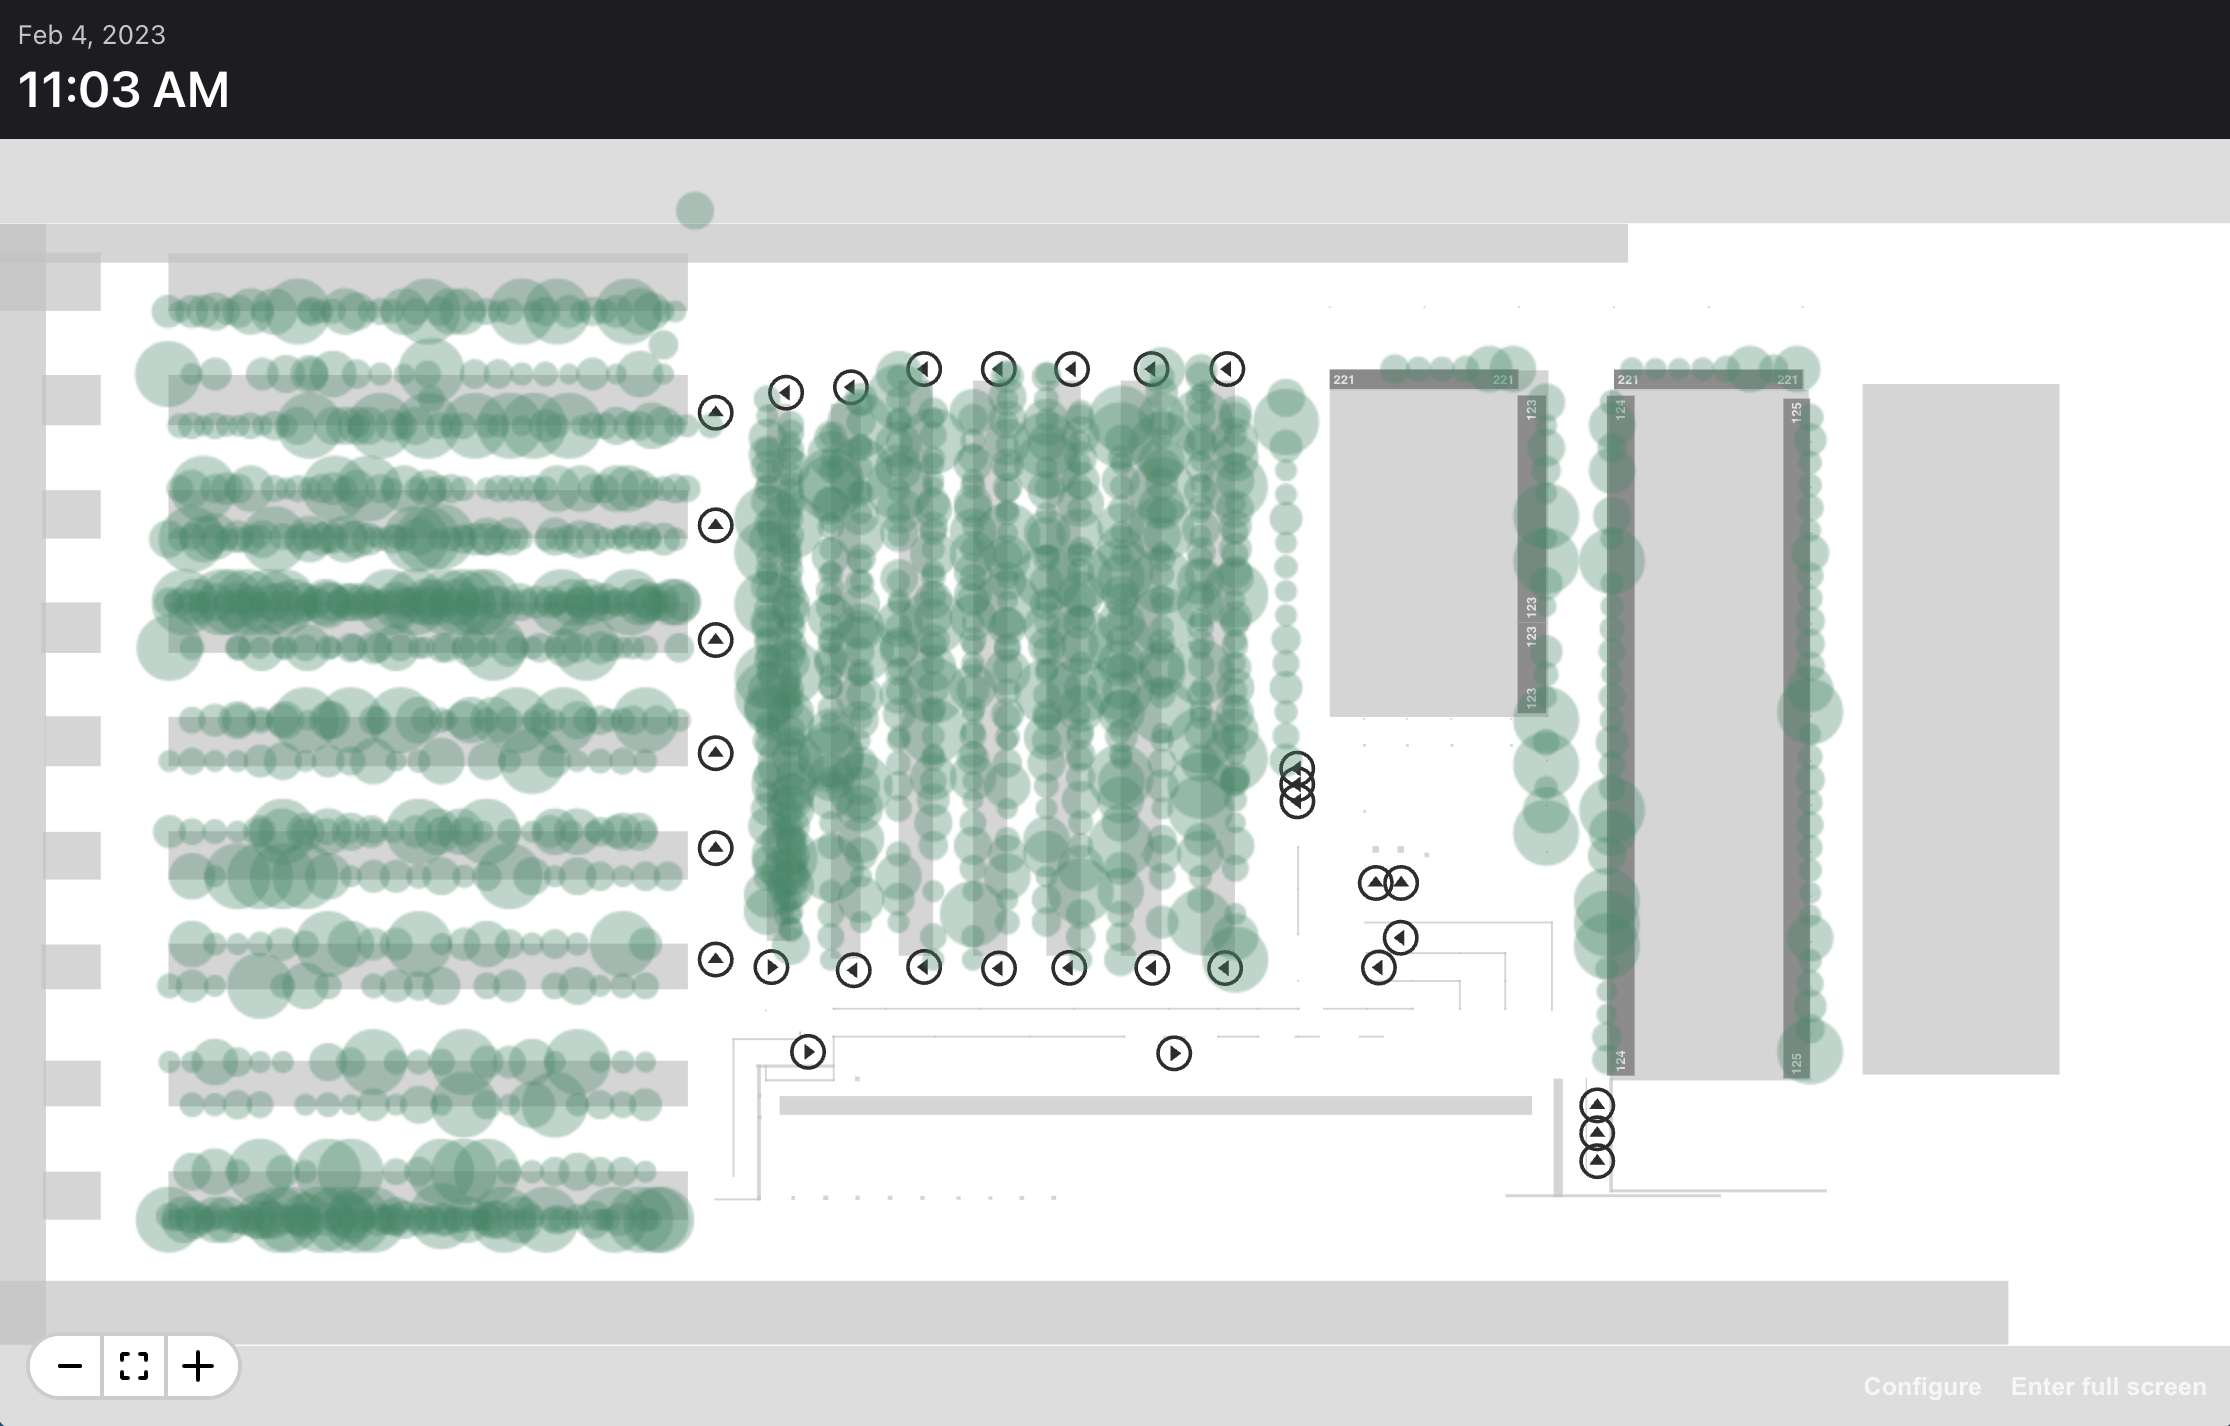
The following demo illustrates the performance power of Canvas, using requestAnimationFrame to schedule animations. As the user zooms in and out, the canvas redraws 1,000 circles at up to 60 frames per second:
The code
First, I exposed a hook, useMapCanvas, that allows client applications to access the drawing context:
Then I added a callback function, onZoom, to the Map component that allows clients to respond to zoom and pan events:
Finally, I could respond to this callback function with an arbitrary drawing routine:
Conclusion
Adding a canvas layer to the map opened the door to all kinds of interesting data visualizations. While SVG excelled at rendering basic map features, Canvas allowed us to render almost anything, and fast!