Clustering markers on a warehouse map
Background
From 2020 to 2023, I developed dashboards and mapping tools for a warehouse automation system using TypeScript, React and SVG.
Problem
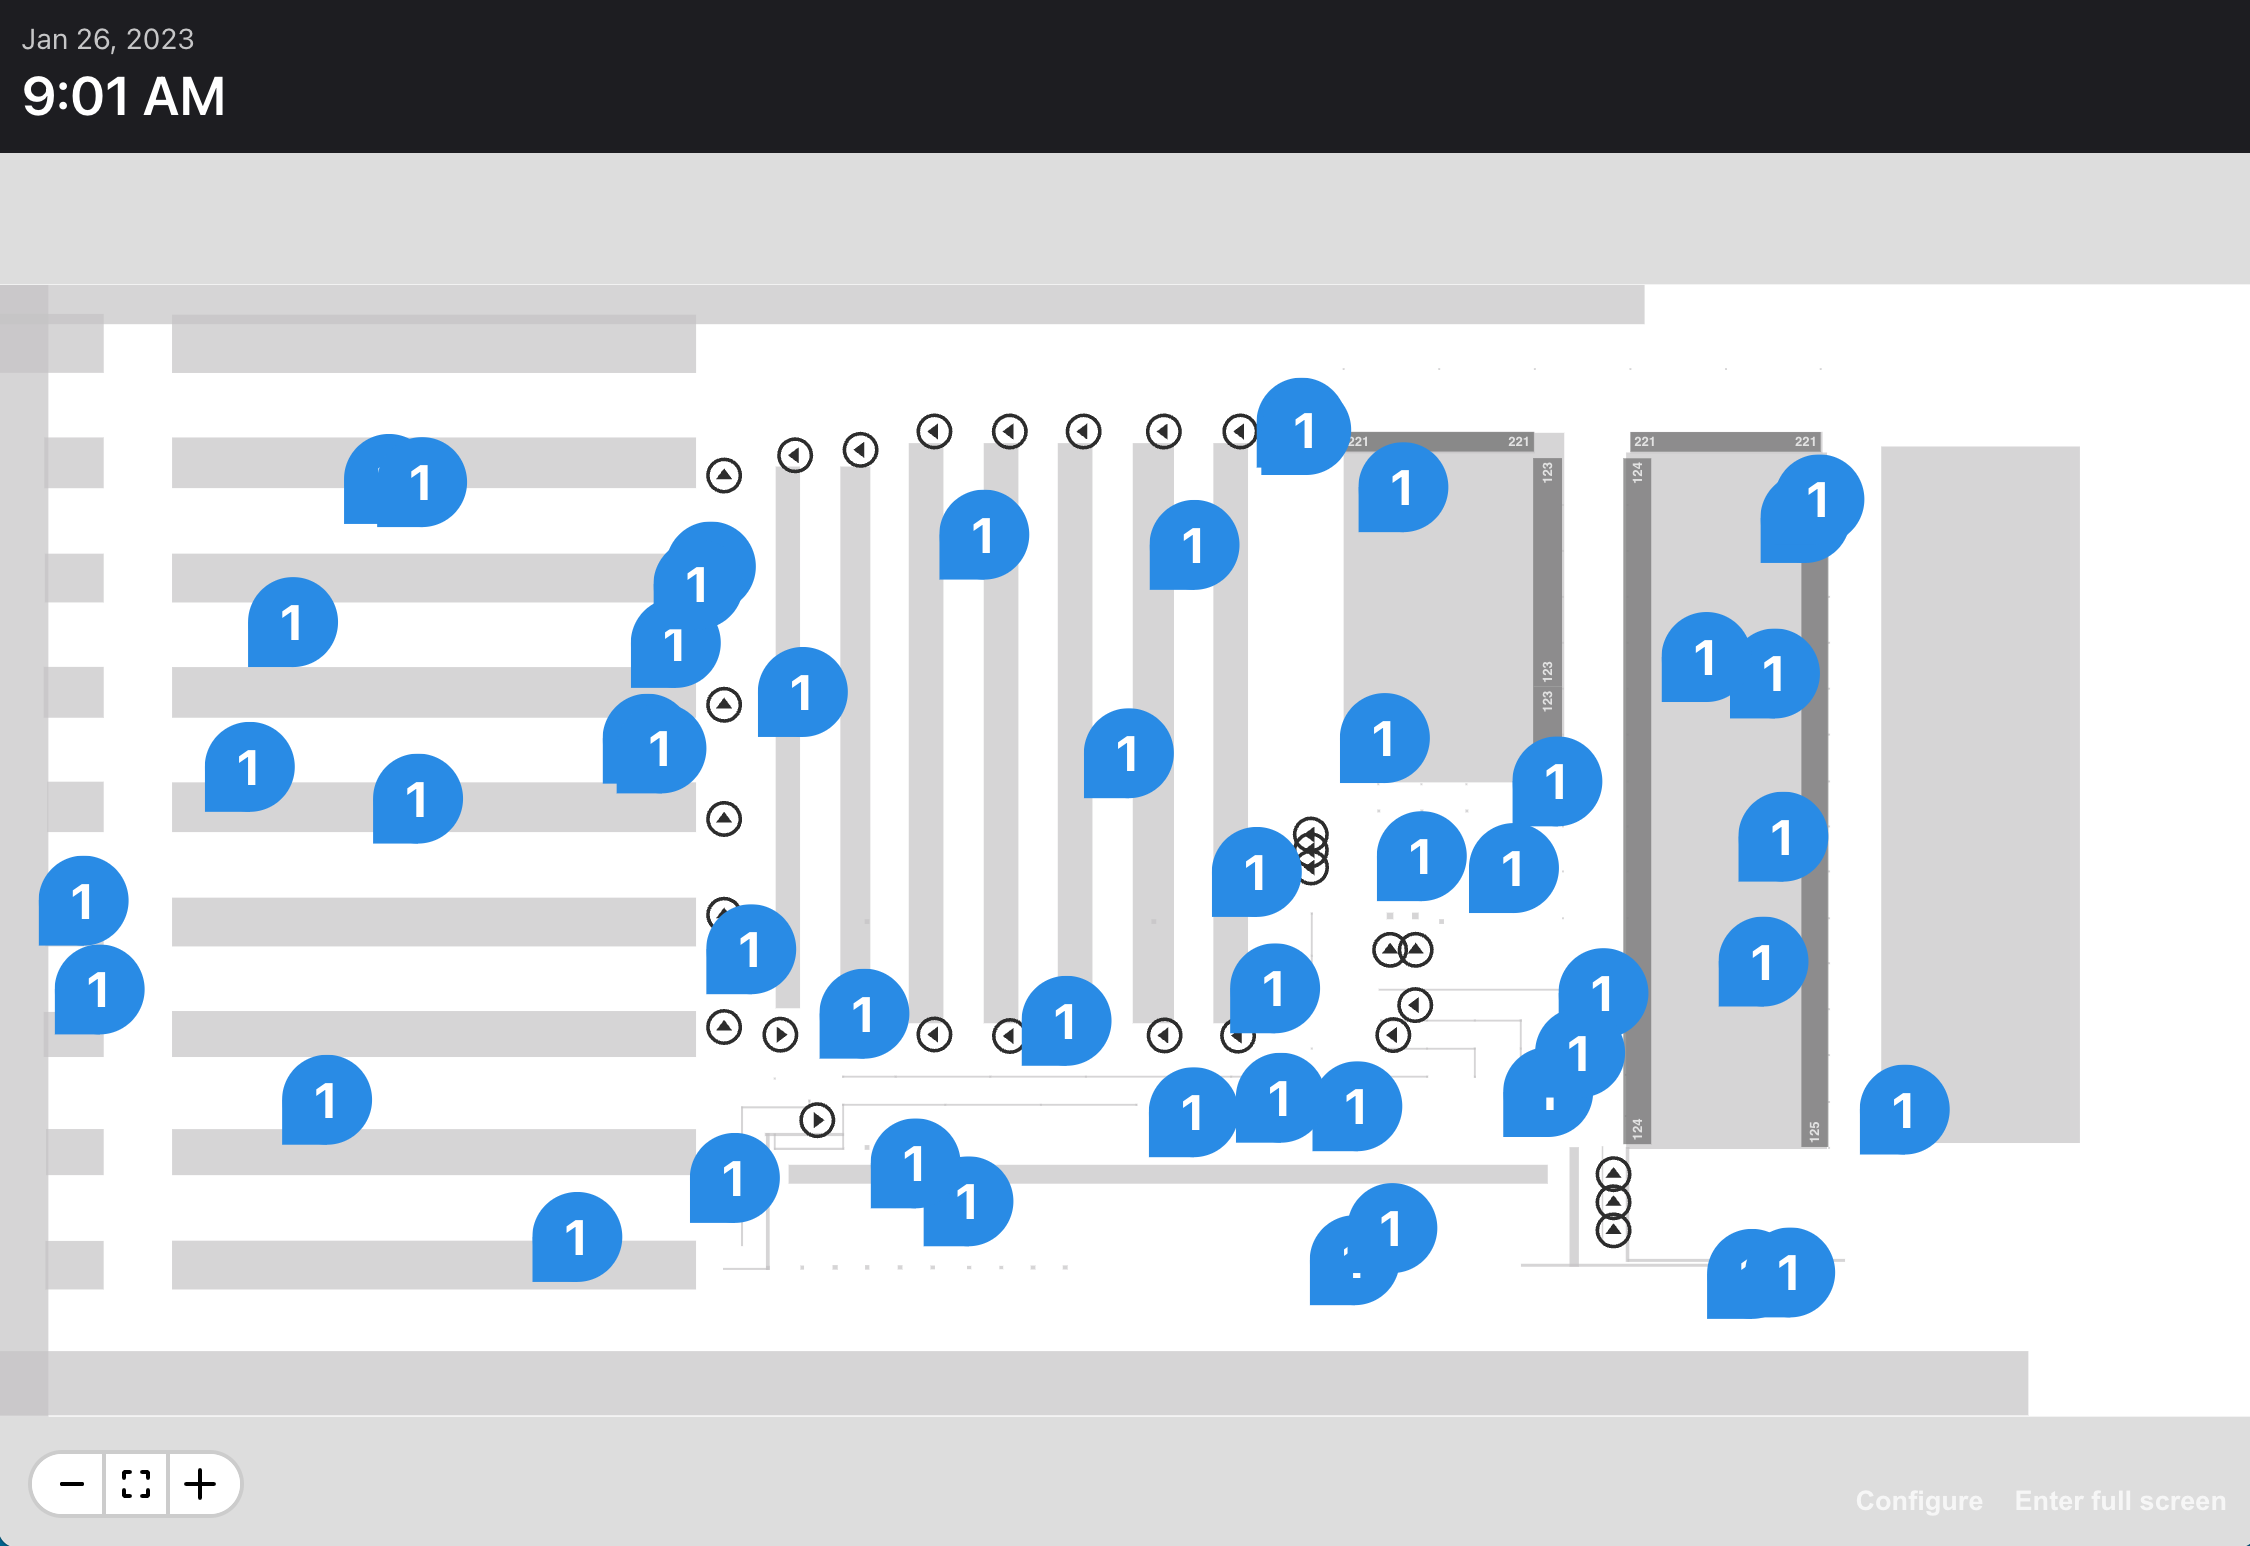
Our custom mapping system supported the arbitrary placement of "markers." Sometimes these markers would overlap, obscuring their values, as shown below. Our map developers needed a way to eliminate this clutter.
Solution
I created a simple clustering function that takes a set of inputs and returns a smaller set of outputs:
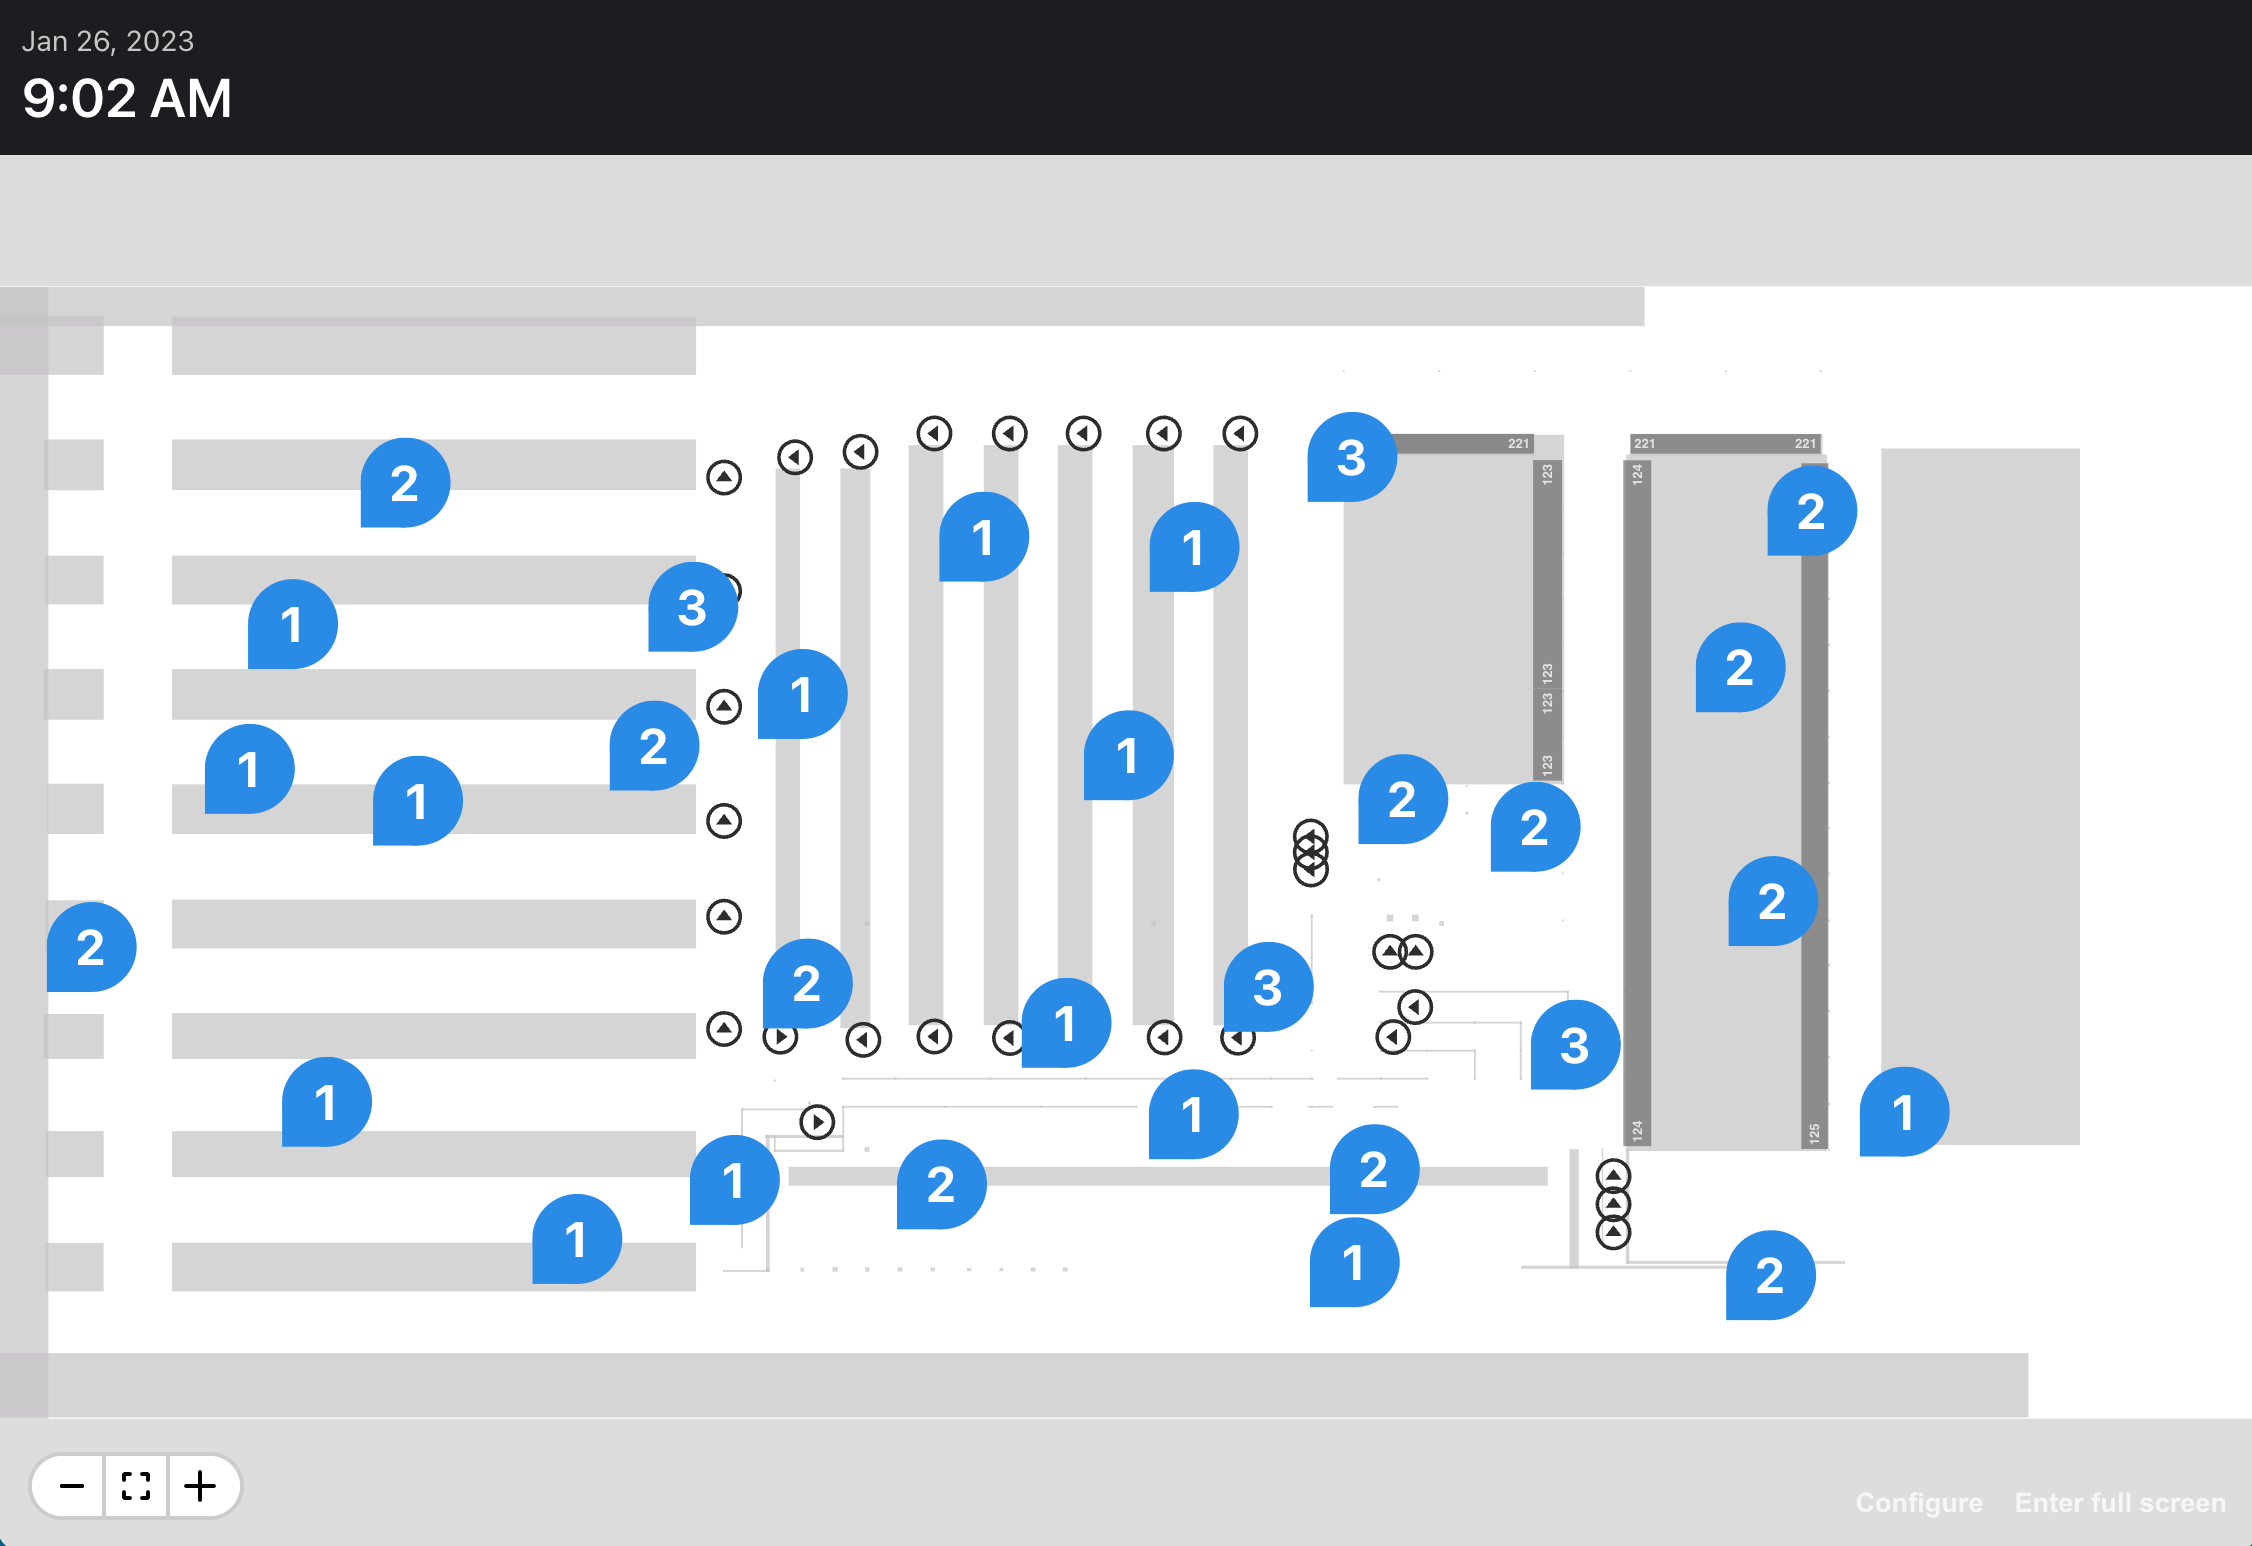
Here's the effect as the user zooms in and out:
The code
First, I created Input and Output types. An input represents a unit of data on the map. An ouput takes the same shape as an input yet also retains a reference to its constituent inputs:
Then I created a utility function that accepts an array of inputs, the current scale of the map, and a search radius (a larger radius packs more data). It returns a smaller array of outputs:
Finally, with just a few extra lines of presentation code, I could pack hundreds of “pins” together:
Conclusion
The clustering function provided an easy and elegant way to declutter the UI—and the DOM!